Large Banks: QT Winners & Losers
- Oct 2, 2022
- 10 min read
October 3, 2022 | Premium Service | A number of readers have asked us to talk about the winners and losers among large banks in the current interest rate environment of quantitative tightening (QT). Below we do just that and more. But first we want to give a big shout out to Dr. Judy Shelton, who asked during a CNBC interview why the FOMC thinks cratering the economy with policies she compares to medieval practice of bleeding is a good way to deal with inflation. The ways and means of the FOMC are ever more statist and authoritarian in nature, a direct threat to free markets and America's civil liberties in general.

If you look around the financial markets, the many fingers of the hand of Uncle Sam including the FOMC seem to be doing their best to foster asset price deflation and general market contagion. The Fed is determined to raise the rate for the mythical market known as Fed funds through the rest of the year. This implies a Fed funds rate above 5% by Christmas. Will the FOMC then stop, look and listen to the results of its actions? Chairman Jerome Powell's stairway to heaven is shown below.

The Fed has ended purchases of Treasury bonds and mortgage backed securities, creating an updraft in terms of yields that has taken the markets back to 2008 levels. Meanwhile, bank regulators at the Fed and OCC are forcing the top 50 banks to raise capital, sell risk assets and/or reduce lending on real estate generally. The top 10 banks could be sellers of a couple hundred billion in 1-4 family exposures in 2022. How is this helpful?
Across the Mall in SW Washington, the folks in the normally quiet agency known as Ginnie Mae are preparing to finalize a draconian capital rule. The new issuer eligibility standards could force a sudden, 20% reduction in the fair value of MSRs held by independent mortgage banks, call it $15 billion in round numbers. Several large issuers are said to be planning big bulk sales of Ginnie Mae MSRs that could crater the $2 trillion government loan and MBS market. The fact that the Biden White House is largely unaware of the impending change by Ginnie Mae should concern members of the FOMC.
As we noted in our recent deep dive into the world of government mortgages (“The Bear Case for Ginnie Mae Issuers”), the new GNMA capital rule could accelerate the collapse of correspondent and wholesale channels across the residential mortgage industry. And this inexplicable action by the Biden Administration will only make worse the deteriorating liquidity situation in 1-4 family loans. Both Fannie Mae and Freddie Mac, for example, are said to be greatly increasing loan repurchase requests to conventional lenders. One insider reveals that these put-backs are a means of getting rid of low-coupon loans that were caught on GSE balance sheets by the Fed's rate hikes.
Against this grim backdrop, we ponder the winners and losers in the world of banking as the Fed ramps up interest rates to the highest levels since 2008. The Institutional Risk Analyst details which banks have stable core deposit funding and those that do not. These banks are seeing deposit rates barely move vs the market facing banks that are seeing funding costs rise faster than anticipated.
Two charts illustrate the growing dichotomy between core funded money center banks and market funded dealers and fintech firms that happen to own an insured depository. First we show interest expense for the core group of top five banks, but without Citigroup (C), which we include with the dealer banks. Citi has a cost of funds more than twice that of the other top banks, so we exclude them to better observe the differences among the other four: JPMorgan (JPM), U.S. Bancorp (USB), Bank of America (BAC) and Wells Fargo (WFC).

Source: FFIEC
As you can see in the chart above, three of the top-four depositories have a cost of funds below that of Peer Group 1, a remarkable statistic given that smaller banks tend to have very stable, cheaper funding. More, notice that funding costs for these banks are barely moving. JPM is seeing funding costs rise more than their large asset peers due to the fact that half of the bank’s business is investments and capital markets. When we look at the capital markets facing institutions, however, the difference is quite striking.

Source: FFIEC
The chart above shows that Citigroup has seen its funding costs rising since Q4 2021, but since the start of 2022 the large subprime lender has been overtaken by Goldman Sachs (GS) in terms of funding costs. Among the large asset gatherers of US banks, GS is generally the highest cost in terms of funding. As was once the case with Bear, Stearns & Co., GS is now the most vulnerable of the top dealer banks when it comes to funding followed immediately by Citi.
Other market facing banks that experience similar magnitude increases in funding costs include Ally Financial (ALLY), which has seen interest expense rise to almost 1% in Q2 2022. CapitalOne (COF) is also seeing funding costs rise “faster than expected,” causing Sell Side analysts to reduce estimates for net-interest margin (NIM) and forward earnings. Discover Financial Services (DFS), One Main Holdings (OMF), Lending Club (LC), and Synchrony Financial (SYF) are likewise seeing funding costs rising faster than asset returns.
Kevin Barker, Managing Director at PiperSandler, put the situation into perspective in a recent note:
“The rapid rise in Fed funds combined with outsized loan growth has led to a significant increase in funding costs for digitally-based depositories, such as ALLY, COF, DFS, SYF, LC, amongst others. After tracking weekly changes in advertised rates, we estimate deposit betas have already reached 60%+ on savings accounts since the Fed started increasing rates six months ago.”

Source: Piper Sandler
Notice that all of the market-facing “digital depositories” are paying deposit rates that are roughly 3-4x the rate paid today by retail funded depositories. The $13 billion bank holding company, SoFi Technologies Inc (SOFI), also saw interest expense as a percentage of average assets rise to 1.16% in Q2 2022.
We've added SOFI to our bank surveillance group. Yeah, that’s right, the nonbank formerly known as SOFI Finance now files a form Y-9 with the Fed and therefore has a nifty BHC performance report. The gross yield on SOFI’s loan book was 7.29% in Q2 2022, a mere 300bp above Citi and in roughly the same neighborhood as COF, which was over 9% gross loan yield in the same period. SOFI has reported losses in its first two Y-9s. Thankfully SOFI has 35% capital to assets, but 50% dependence upon noncore funding makes us a little nauseous.
With a 126% efficiency ratio, SOFI is reporting operating losses and needs to grow revenue another 50% or so to catch up with the bank’s overhead expenses. With half the portfolio in loans and the other half in securities, it is small wonder that the company is not profitable. Yet the yield on earning assets at 5.5% is twice the rate achieved by most large banks. This company needs to get bigger.
Size aside, the financial problem to be solved by SOFI is how to get earning assets from 70% of total assets up into the high 80s or low 90s percentile. The same measure for USB, for example, is 92%. If you strip SOFI of the hype associated with fintech, this new bank is a distinct underperformer with a dependence upon volatile market funding. In fact, SOFI’s cost of funds went up more in percent in Q2 than JPM paid for all funding in the same period. No surprise, SOFI is the worst performing bank in our surveillance group.

Source: Bloomberg
Understanding the haves and the have nots in banking as 2022 ends begins with funding costs, but then quickly ripples through the rest of the income statement. Next we consider net credit losses vs average assets, yet another category where GS leads the way among the asset gatherers. Since embarking on its journey to organically grow a retail bank, GS has demonstrated a surprising amount of operational problems, made clear by the high credit losses and low operating efficiency.

Source: FFIEC
Notice that GS “only” wrote off 25bp in losses this quarter vs total assets, but the firm is a clear outlier among this group. Even more, the bank’s loan book is less than 10% of total assets! GS manages to lose more money than its asset peers among the money centers even with a smaller loan book. In terms of the other asset gatherers such as Morgan Stanley (MS), you can see that these firms have low or no credit losses. The green line at the bottom of the chart is Charles Schwab (SCHW), for example, which basically has zero credit losses, making the GS outlier position even more remarkable.
When we look at the large banks in terms of credit losses, we keep Citi in the mix this time to illustrate the difference between the retail focused money centers such as BAC, WFC and USB, and the universal banks such as JPM and C. Note that Citi’s loss rate is more than 2x the other banks and the average for Peer Group 1, followed by USB and JPM. BAC and WFC in order of greatest mediocrity at present. The average loss rate for Peer Group 1, reflecting the smaller banks in the group, is at the bottom of the chart.
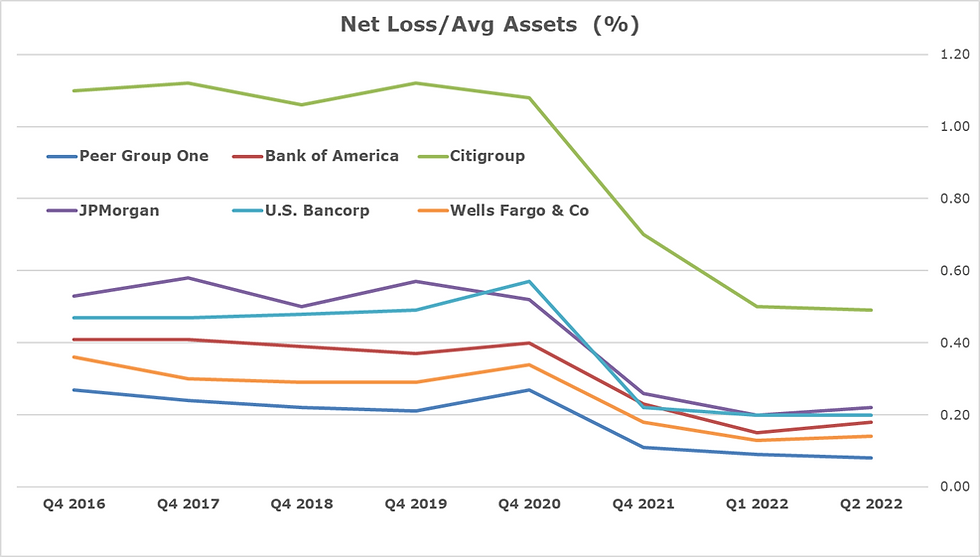
Source: FFIEC
The fact that BAC and WFC have low loss rates is admirable, but what both banks need is to prudently take more risk via more lending volume and yield. Sometimes loss rates, as with USB, can be a sign of a profitable lending business. Indeed, even though Citi has a gross yield on its loan book that is 200bp above USB, the latter takes more profit down the net income line due to superior operating efficiency – two points better than Citi in Q2 2022.

Source: FFIEC
Notice in the chart above that BAC has the worst loan yield of the top five money centers, hardly a ringing endorsement. JPM is pretty much dead on the average for Peer Group 1, a remarkable testimonial to the pricing discipline of the House of Morgan compared to the average for the top 132 banks.
Citi, because of its subprime consumer lending and credit card portfolio, has far higher yields than the rest of the group. Yet of the $2.3 trillion in average assets at Citi in Q2 2022, less than $700 billion was loans. The vast majority of Citi’s balance sheet is low-earning securities and deposits with banks, one reason the performance of the bank under Jane Fraser remains mediocre. But as Citi seeks to increase returns, the danger remains that this only partly core-funded bank could again get into a liquidity trap.
Generally smaller banks have 100-200bp better pricing on their loan books than their large peers. When we look at the loan pricing for the asset gatherers, however, the picture changes dramatically.

Source: FFIEC
Notice that SCHW, RJF and MS are at the bottom of the chart in terms of loan pricing, but GS is chasing the Peer Group 1 average, a clear illustration of the business model differences between GS and the rest of the asset gatherer group. Lending is generally a secondary activity for the universal banks, yet notice that the pricing on their portfolios is actually better than that of BAC and WFC.
Once we consider funding costs, credit loss rates and credit spreads, the next factor to examine is income. First we inspect the asset gatherers and find, to no surprise, that Raymond James Financial (RJF) is top of the heap when it comes to net income vs total assets of the bank holding company. As we’ve written previously, RJF is the best performing bank in our surveillance group when it comes to equity market valuations.

Source: FFIEC
While the bank side of RJF is a little idiosyncratic in terms of credit loss experience, a fact we attribute to the bank’s small size relative to the business of the broker dealer unit, the overall financial performance of RJF is very solid. Remember, the form Y-9 is a consolidated look at the whole firm, bank and dealer, as one entity, but does not show the entire advisory book controlled by RJF. The firm has over $1 trillion in advisory assets, including $800 billion in assets under management in proprietary mutual funds and annuities.
GS, on the other hand, is at the bottom of the group in terms of income vs total assets. We attribute this to the large size of the dealer within the GS organization and the relatively small size of Marcus as a bank, which must compete for funding on the Internet bulletin boards with weak players such as ALLY. At the end of Q2 2022, GS had a yield on earning assets of just 1% vs an average over 3% for Peer Group 1, a striking metric that speaks to the continued dependence of GS on non-interest income such as trading and investment banking to support revenue.

Source: FFIEC
Notice that USB is basically even with the smaller, more profitable banks in Peer Group 1 while the rest of the money centers are still stuck below 1% ROA. JPM and USB have the best operating efficiency of the top-five banks, but note in the table below that the average efficiency for Peer Group 1 is 59. Over the next year, all of these larger institutions need to get near or below 60% efficiency in order to survive in the winter of QT.

Source: FFIEC
Bottom line for us is that there are two groups of banks, core funded depositories and market facing dealers and finance companies. These two groups then fall into three sub-categories:
The large majority of US banks fall into the first category, including BAC, WFC, USB and JPM, but the House of Morgan is only half bank. JPM will see its funding costs rise faster than the other money centers.
The market facing institutions such as GS, COF, DFS, SOFI, LC and ALLY are far more vulnerable to rising interest rates and periods of market liquidity stress.
The asset gatherers such as RJF, MS and SCHW are largely sheltered from the storm because of big balances of bank core deposits generated by the advisory business and low credit exposure.
Disclosure: CVX, CMBS, NVDA, WMB, JPM.PRK, BAC.PRA, USB.PRM, WFC.PRZ, WFC.PRQ, CPRN, WPL.CF, NOVC, LDI, SWCH
The Institutional Risk Analyst is published by Whalen Global Advisors LLC and is provided for general informational purposes only and is not intended for trading purposes or financial advice. By making use of The Institutional Risk Analyst web site and content, the recipient thereof acknowledges and agrees to our copyright and the matters set forth below in this disclaimer. Whalen Global Advisors LLC makes no representation or warranty (express or implied) regarding the adequacy, accuracy or completeness of any information in The Institutional Risk Analyst. Information contained herein is obtained from public and private sources deemed reliable. Any analysis or statements contained in The Institutional Risk Analyst are preliminary and are not intended to be complete, and such information is qualified in its entirety. Any opinions or estimates contained in The Institutional Risk Analyst represent the judgment of Whalen Global Advisors LLC at this time, and is subject to change without notice. The Institutional Risk Analyst is not an offer to sell, or a solicitation of an offer to buy, any securities or instruments named or described herein. The Institutional Risk Analyst is not intended to provide, and must not be relied on for, accounting, legal, regulatory, tax, business, financial or related advice or investment recommendations. Whalen Global Advisors LLC is not acting as fiduciary or advisor with respect to the information contained herein. You must consult with your own advisors as to the legal, regulatory, tax, business, financial, investment and other aspects of the subjects addressed in The Institutional Risk Analyst. Interested parties are advised to contact Whalen Global Advisors LLC for more information.


Comments