Update: Commercial, Residential Loans & MSRs
- Apr 5, 2021
- 13 min read
April 5, 2021 | This week in the premium service of The Institutional Risk Analyst, we take stock of the uneven situation facing banks, REITs and bond investors holding commercial and residential real estate assets three months since the inauguration of President Joe Biden. We also update readers of The Institutional Risk Analyst on developments in the market for residential mortgage servicing rights (MSRs), perhaps one of the hottest institutional strategies for 2021.
Commercial Real Estate
The commercial loan sector continues to show signs of moderating stress looking aggregate data from bank balance sheets and commercial mortgage-backed securities (CMBS). The credit performance of commercial and multifamily loans in March was the best in nearly a year, yet there also was a slight month-to-month uptick in payments missed, the Mortgage Bankers Association reports.
Some 95% of commercial and multifamily loans were current on payments in March, up from 94.8% in February, according to the MBA's CREF Loan Performance Survey. But average delinquency ticked up slightly, suggesting that investors and landlords face a long road ahead. Given the lack of true visibility into this entirely lumpy asset class, use aggregate survey data on commercial real estate (CRE) loans with great caution.
In the public equity markets, the valuation for commercial REITs followed the larger complex of financials higher since our last report in January with the rally in interest rates. From a low of 0.4x book value a year ago, the mortgage REITS tracked by KBW reached 1.1x book in February, but traded off since then on worries of rising interest rates and uncertainty as to credit trends. Visibility into the actual condition of many equity REIT portfolios is poor.
Like REITs and even leading residential nonbank mortgage lenders such as Rocket Companies (NYSE:RKT), the public market valuations for US financials peaked in early February, when mortgage interest rates touched the low for this cycle. Note, however, that yields on the benchmark 10-year Treasury note started working higher last Summer and Fall. The rate spike in February marked the acceleration of an existing trend higher in interest rates.

When assessing commercial read estate credit, we always remember the sage wisdom of our friend Alex Pollock, Principal Deputy at the Office of Financial Research in Washington. He reminded us years ago that most of the commercial exposures in a typical commercial bank are tied to real estate one way or another. The chart below shows the delinquency for $2.5 trillion in commercial loans held by US banks, roughly half of which is explicitly tied to commercial property. We discussed this series in detail in the latest IRA Bank Book for Q1 2021.

Source: FDIC
Much of the pain now being felt by owners of commercial real estate is obscured behind the world of equity REITs, a $3.5 trillion gross asset market that is largely funded with public and private equity and, indirectly, mortgage debt held by banks and bond investors. Cooperative apartments and condominiums are frequently financed via first lien mortgages held by local banks.
“The balance of commercial and multifamily mortgages that are not current decreased in February to its lowest level since April 2020,” reports the MBA. Some 94.8% of outstanding loan balances were current, up from, 94.3% in January. An average of 3.5% were 90+ days delinquent or in REO, down from 3.6% a month earlier. The chart below shows the largest components of the universe of commercial real estate assets held in REITs, banks and CMBS. Single- and multi-family rentals are not shown.

Source: NAREIT, FFIEC, TCW
After REITs, the property component of the $3 trillion in commercial and multifamily bank loans follows in terms of sheer size. Default rates on multifamily loans held by banks remain suppressed by the CARES Act and state law debt payment moratoria, but loss given default (LGD) on these loans is finally rising after years in negative territory, as shown below.

Source: FDIC/WGA LLC
Last in size in the world of commercial real estate is the world of CMBS, which totals about $600 billion in total outstanding issuance, including some $400 billion of that amount in CRE conduit loans of varying descriptions, a chopped salad of commercial property exposures. The CMBS market peaked at $750 billion in 2008, then sold off down to $500 billion by the end of 2017, then began a slow climb back to present levels. New issuance flattened out at the end of 2019 and has gone sideways ever since.
In the world of CMBS, the average delinquency picture continues to improve with the US economy, but with a heavy emphasis on location. Assets located in the major cities remain under severe downward price pressure due to tenant defaults and payment moratoria, but assets in suburban and rural areas are fairing better.
“Delinquencies improved across all CMBS sectors but SFR-M in February,” notes asset manager TCW. “Conduit delinquencies decreased 16 basis points to 7.92%; SASB-S delinquencies decreased by 13 basis points to 1.85%; SASB-M delinquencies decreased by 343 basis points to 4.66%; Freddie loans delinquencies decreased by 5 basis points to 0.19%; SFR-S delinquencies were flat at 0.0%; SFR-M saw an increase in delinquency of 8 basis points to 2.83%.”
The main worry for the future in terms of CRE and CMBS both are elevated vacancy rates, which in turn reduces income and valuations. Average vacancy rates for office buildings across the US are hovering around 20% nationally. Published statistics from landlords are taken at face value in the media, but do not factor in the amount of inventory that has been deliberately taken off the market.
Landlords are trying to manage office inventories for scarcity in order to recover pricing power in many urban markets. Likewise, published retail vacancy rates nationally are around 10% and apartments are in the mid-single digits, according to the MBA. Again, location, location is what matters.
While the fact of federal credit guarantees allows us to treat residential assets as homogeneous, with CRE the story is totally different. Different property types have been impacted by COVID in different ways, thus the national averages for prices and rental revenues, for example, are completely useless for an investor focused on a specific asset in a specific market. Last week, we took the photo below of the F train station on 57th & Sixth Avenue in Manhattan. What is missing?

Midtown Manhattan, Thursday April 1, 2021
We expect that the changes in behavior, asset utilization rates and thus revenue due to COVID have impacted office buildings in major urban metros for years to come. If we see further contagion in US cities due to permutations of COVID now visible in Latin America and Asia, then these moribund urban assets may be permanently impaired. Long commercial lease terms hide some of the downside price effects of this change in behavior, but reports of major tenants such as JPMorganChase (NYSE:JPM) seeking to sublease large blocks of office space in New York are not a bullish indicators.
Last year saw significant declines in sales volumes for most CRE assets, but industrial and multifamily assets rebounded in Q4 2020, the MBA reports. Cap rates have fallen slightly on a national basis looking at the averages gathered by the MBA and TREP, but again, it is the particular location and use of assets that tells the tale in terms of asset valuations and cap rates.
In Manhattan, for example, discounts of 40-50% and other cash concessions are reported in The New York Times as signs of optimism for the residential apartment market. Observes C.J. Hughes: “From soaring condos in affluent enclaves like TriBeCa to boutique buildings on gentrifying blocks in the East Village, Manhattan is awash in price cuts.” But sadly, Manhattan is not awash in people, the key ingredient that makes the city possible in economic terms.
The credit implications of large price concessions and discounts are obviously horrific and suggest many properties are, in fact, under water. Cap rates are in a free fall at the moment, though “value buyers” are reported to be coming into the market. Our view is that we still have not found the bottom in terms of valuations because the net operating income (NOI) part of the equation remains entirely speculative. Whereas Manhattan buildings traded at double digit multiples to NOI prior to COVID, today these assets are, in theory at least, in mid-single digits.
Commercial assets located in legacy cities such as New York and Chicago, for example, are likely to be suffering in terms of remittances for many years to come. Thus, the NOI and thus the long-term value of the asset is questionable. While the national delinquency rate for CMBS is in mid-single digits nationally, different sectors are showing wide dispersions in asset performance and loan to value (LTV) ratios. Single asset single borrower CMBS are averaging just above 100% LTV while hotels are over 200%. Offices are far better across all CMBS vintages, but the lack of price discovery makes these numbers suspect.
Kroll Bond Rating Agency, for example, noted in its March surveillance report on the nearly $300 billion in CMBS deals (roughly 50% of the market) rated by that agency’s veteran team:
“The March delinquency rate held steady, at 5.9%, compared to February.
“The lodging delinquency rate increased to 17.2% versus 16.7% in the previous month. However, the delinquent and specially serviced rate among lodging loans actually decreased to 21.6% from 21.9%. About 40% of the new delinquencies were listed as current but with the special servicer in the prior month.
“Multifamily and office also recorded increases in their delinquency rate, to 3.3% from 2.2% and 1.5% from 1.3%, respectively. The increases were driven by a couple of larger newly delinquent New York City loans, including Yorkshire and Lexington Towers, a $400 million loan secured by a multifamily property in New York City and 3 Park Avenue, a $182 million loan secured by an office property. Both were not with the special servicer in February.”
In illustration of the choppy nature of the assets that comprise the CMBS world, especially in the larger urban centers, KBRA continues:
“The overall conduit delinquency rate fell 80 bps to 7.1% from 7.9% during this period. However, not all MSAs trended lower, with New York and Chicago recording the highest increase in their delinquency rates (150 bps to 9.6% and 120 bps to 12.1%, respectively). Atlanta and Miami fared better, recording the biggest improvement in their delinquency rates (240 bps to 5.5% and 180 bps to 8.7%). Further, a breakdown by property type showed two notable lodging delinquency rate changes—New York City (rising to 44% from 23.8%) and Atlanta (declining to 13.7% from 25.5%) over the six-month period.”
We believe that the published statistics on REITs, bank CRE and multifamily, and CMBS understate the degree of credit impairment and ultimate loss severity in the commercial asset class. Landlords around the country and particularly in urban areas continue to put a brave face on a very serious situation where underutilized assets and falling remittances threaten to undermine NOI, valuations and private and municipal credit over the medium to long term.
The sharp decline in sales of large commercial and multifamily properties in Q4 2020 speaks volumes as to the uncertainty regarding valuations. Published net absorption rates for commercial office space, to take another example, are negative but still understated because landlords are taking assets off the market entirely.
In New York City, for example, we estimate that commercial absorption rates published by firms such as Cushman & Wakefield are significantly below the actual rate. The current national vacancy rate of 18% published by REIS, a 26-year high, may still be considerably understated in cities such as New York. Unless and until we start to get a better handle on NOI and thus cap rates, we think buying legacy assets in major US metros is a crap shoot at best.
Residential Mortgages
In stark contrast to the dire situation facing investors and landlords with CRE exposures, the credit situation facing investors in 1-4 family mortgages remains benign, almost surreal, with net loss rates for bank owned loans near zero and LGD for bank and even conventional loan exposures likewise deeply suppressed by 1) massive purchases of T-bills and RMBS by the FOMC and 2) the relative scarcity of 1-4 family homes.
The chart below shows LGD for bank owned 1-4 family mortgages through December 2020. Note that like the multifamily series, we are starting to observe upward spikes now that suggest a change in direction after five years of falling loss severities for residential assets.

Source: WGA LLC
While the credit picture in prime 1-4s and even conventional loans owned by the GSEs are in good shape, the credit picture in government-insured assets is decidedly negative. HUD Secretary Marcia Fudge said a week ago: "Given the current FHA delinquency crisis and our duty to manage risks and the overall health of the fund, we have no near-term plans to change FHA’s mortgage insurance premium pricing. We will continue to rigorously evaluate our strategy and work transparently with Congress.”
Fudge’s statement accompanied HUD’s quarterly report to Congress on the financial status of the Mutual Mortgage Insurance Fund, which noted that the rate of seriously delinquent mortgages has increased from 4% to 12% in the past year, while early payment defaults have risen from 1% to 6%.
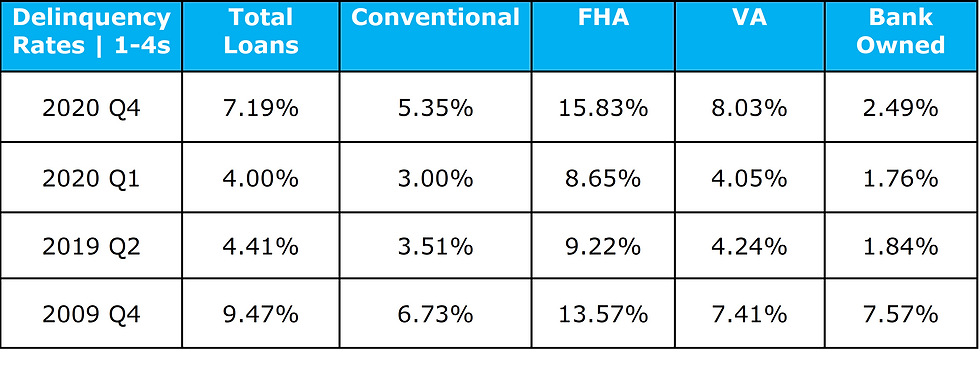
Source: MBA/FFIEC
Notice that delinquency rates for bank-owned and conventional loans generally are below 2009 levels, when the US banking industry charged off over $100 billion in impaired private label mortgages. Delinquency rates for FHA loans are higher, however, suggesting that the impact of COVID on US homeowners is falling disproportionately on lower income borrowers. We suspect that a large portion of government loans will cure and get back on track, but there could still be millions of households that require some form of assistance, a loan modification or will end up in foreclosure.
The immediate challenge facing the residential mortgage industry, however, comes not from credit loss but rather then sharp deceleration in mortgage lending and particularly refinance transactions since the inauguration of President Joe Biden. The negative reaction of the bond market to the fiscal program of the Biden Administration has seen with the sharp rise in benchmark bond yields. The chart below shows the latest actual quarterly survey data and projections from the MBA for residential mortgage originations.

Source: MBA
The sharp decline in refinance volumes projected by the MBA is a function of interest rates, while the purchase volume decline is impacted by rising rates and also affordability and home availability after several years of double-digit gains in home prices.
We continue to believe that purchase and refinance volumes will out-perform the MBA’s projections, but wholesale channel buyers such as RKT, loanDepot (NYSE:LDI) and United Wholesale Mortgage (NYSE:UWM) are likely to be hurt by falling volumes. Lenders with stronger purchase businesses and established retail channels such as Caliber, Freedom, Guild Holdings (NYSE:GHLD), and Amerihome, which is being acquired by Western Alliance Bancshares (NYSE:WAL), are likely to benefit.
In addition to our concerns over interest rates and volumes going forward in the residential loan market, the twin risks of credit and prepayments are also very much in mind, as illustrated by the Ginnie Mae issuer data shown in the table below. These are the top 25 seller/servicers operating in the government loan market.
Top 25 GNMA Issuers (February 2021)

Source: Ginnie Mae
Note that while issuers such as Wells Fargo (NYSE:WFC) and RKT have relatively pedestrian levels of delinquency, the nonbank issuers such as Mr. Cooper (NYSE:COOP), Lakeview and Freedom are down in the mid-80 percent range in terms of performing loans. Also, both Lakeview and PennyMac (NYSE:PMT) have loaded upon on early-buyouts (EBOs), along with COOP, WFC and U.S. Bancorp (NYSE:USB). These EBO trades looked like home runs six months ago, but may be more like singles or strikeouts today depending on how those delinquent loans are resolved.
Both with respect to COVID loans and delinquency more generally, mortgage servicers face an increasingly hostile environment in terms of the regulatory world. With radical progressives now calling the shots at the Consumer Financial Protection Bureau (CFPB), we expect to see renewed flows of enforcement actions. The latest COVID relief legislation essentially forces lenders to play counselor and wet nurse to distressed consumers and without any compensation for their efforts.
As we’ve noted in previous reports, the cash cost of resolving delinquent loans in the FHA/VA/USDA market can easily reach into tens of thousands of dollars, particularly when the CFPB is forcing loan servicers to serve as credit counselors. With the added threat of regulatory sanctions and fines, GNMA issuers face substantial risk in the weeks and months ahead as the industry works through the remaining COVID loans subject to forbearance.
Funding and fixing delinquent COVID forbearance loans is a loss leader for government lenders and a significant source of financial and reputational risk for publicly owned issuers. The public attack on Ocwen Financial (NYSE:OCN) by the CFPB under Richard Cordray and state regulators in 2018 over bogus escrow account allegations is a case in point that should not be forgotten. After three years of litigation, OCN largely defeated the CFPB in court but OCN shareholders paid a terrible price in the meantime.
Mortgage Servicing Rights
With interest rates rising and production volumes falling, it makes sense that mortgage servicing assets are also rising in value. Large investors have already figured this out. Still, high prepayment rates are somewhat blunting the enthusiasm for this naturally occurring negative duration asset. That said, the steady rise of interest rates since last summer managed to push up the value of bank-owned MSRs for the first time since the middle of 2019.

Source: FDIC
Banks actually managed to return to profitability on servicing after a year of negative net servicing results. Fat gain on sale margins made up for this, however, with the industry taking down $27 billion in gain on sale for RMBS issuance in Q4 2020, according to the FDIC. If the banks could even approach the levels of efficiency of independent mortgage banks (IMBs) in the residential market, the gain on sale number could have been over $50 billion in Q4 2020.
With the fair value of bank-owned MSRs now below $30 billion, this means that IMBs now control something like $60-70 billion in servicing assets. As the 10-year Treasury climbs towards 2% but short-term rates remain nailed to the floor thanks to QE, there is growing speculation that the FOMC may be forced to raise rates sooner rather than later. In the event, the improving valuation environment for MSRs is likely brighten even further.
The Treasury curve is essentially flat out to 24 months and then goes up at a fairly steep rate. The change in coupon spreads suggests an expansion of MSR valuations, but then there is the question of gain-on-sale margins. The primary “asset” inside the MSR is the opportunity to refinance the loan for the consumer and thereby gain a 4-5% gain-on-sale into an RMBS. Normally it takes five years of collecting servicing fees to equal the profit from one refinance event. Remember that 2020 was one of those rare periods when lenders actually were up on cash after the close and sale of a residential mortgage loan.
The RMBS spread to Treasury’s peaked last March at almost 2% and has since slowly compressed to about 75bp today. Meanwhile, prepay speeds remained high in February despite expectations of slowing. The percentage change in prepays speeds was higher in newer vintages, according to SitusAMC, but overall prepayments remain high. Thus, while investors want to put more cash to work in servicing assets, the task of picking the right entry point remains painful.
As lending volumes and secondary market profit spreads revert to low and eventually no profitability, lenders will look to the MSR cash flows and refinance opportunities to make up for the cash loss on new lending. Valuations will rise and, in particular, the capitalization rate of new government MSRs will expand from the ~ 80bp/ 2.5x multiple average we saw in last quarter’s earnings.
New production capitalization levels for government 3% coupons are above 3.25x and headed to 3.5x annual cash flow by the time March data is released. It will be interesting to see where public banks and IMBs mark their legacy servicing in Q1 2021 earnings compared with new issue coupons with slower prepayment speeds.
Meanwhile, we continue to believe that issuers, REITs and funds with excess liquidity should be accumulating conventional servicing with both hands. GNMA servicing is a different matter entirely, but holds great value if the investor works with the right servicer. Remember, the beginning of February 2021 was probably the inflection point for interest rates for years to come.
If our suspicion that the FOMC has lost control of the Treasury curve proves correct, then MSRs could be a fabulous trade for institutional investors that have the right relationships with issuers and servicers. As shrinking margins squeeze profits for lenders in 2021, the ability to recapture refinance events and retain those loans in portfolio will grow in importance.


Comments