
Profile: Morgan Stanley vs Goldman Sachs
- Apr 17, 2022
- 6 min read
Updated: Apr 17, 2022
April 18, 2022 | Premium Service | Last week Goldman Sachs (GS) and Morgan Stanley (MS) reported Q1 2022 earnings. Both firms managed the return to “normal” reasonably well in terms of overall results, but the former continues to evidence a high degree of volatility in line items that ought to be stable.
Dick Bove put the situation well last week, saying that Goldman Sachs needs to demonstrate “to what degree can it control its destiny?” That is the right question for readers of The Institutional Risk Analyst to ask as the FOMC is prepares to end QE, significantly raise interest rates and normalize credit costs along with it. Both MS and GS essentially have three business lines:
Institutional Securities, including capital markets and investment banking
Wealth Management, including advisory and brokerage services for individuals, and
Investment Management, including institutional investment services and funds
GS further breaks down its institutional securities business into global markets and investment banking, a revealing choice that illustrates the firm’s dependence upon trading the markets and other transactional business. The stable periodic income generated by the MS wealth and investment management lines stand in sharp contrast to Goldman's volatility. Neither firm breaks out commercial lending as a separate business line, but in the case of GS, credit may be a future vulnerability.
In terms of AUM, MS had $1.6 trillion in assets under management in proprietary mutual funds and annuities at the end of 2021 vs just $595 billion for GS, according to the FFIEC. MS generated $1.6 billion in fees from this AUM vs $1.3 billion for GS, suggesting that Goldman Sachs clients are paying significantly higher fees for the privilege.
The first observation to make in comparing MS with GS is that the latter has far greater volatility in its financial results. What GS labels “Asset Management,” which is the firm’s institutional investment business, swung from $4.6 billion in Q1 2021 to just $546 million in Q1 2022, an 88% decline YOY and a 81% decrease sequentially. The chart below shows the net revenue by segment for Goldman Sachs from the firm’s Q1 2022 results.
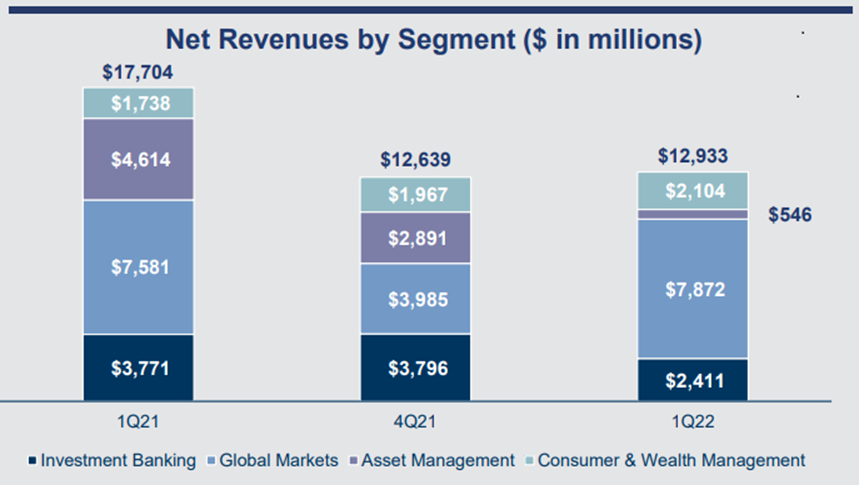
MS reported a modest increase in net revenue YOY and a 24% decline sequentially, but Wealth and Investment Management lines were relatively stable. Consumer and Wealth Management at GS, by comparison, grew 21% YOY and rose 7% sequentially. These two GS revenue line items are relatively small compared with Global Markets and Investment Banking, which tend to account for the lion’s share of revenue. At MS, by comparison, Wealth and Investment Management regularly account for roughly half of firm revenue, as shown in the table below from the MS quarterly results.

MS has made the progression from independent investment bank before 2008 to universal bank and asset manager in the years that have followed. GS, on the other hand, pays lip service to growing its banking business, but continues to focus its financial and human resources chasing high-risk investment banking revenue. The result at GS is a more volatile business model than MS, with a smaller core deposit base and, significantly, higher credit losses than the 130 members of Peer Group 1.
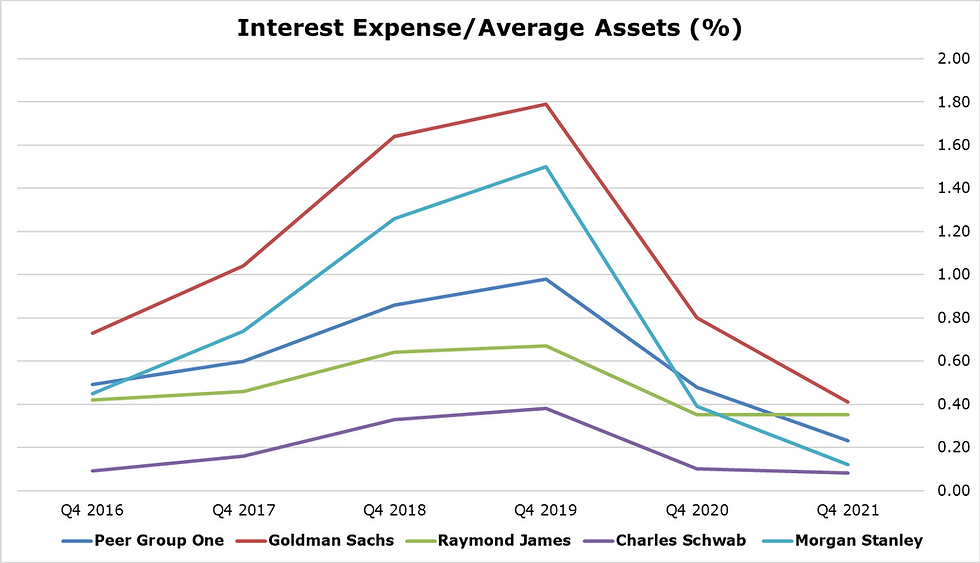
At the end of 2021, MS had $329 billion in core deposits vs less than $200 billion for GS. Both firms have been focused on growing banking deposits, but MS has been willing to grow liquidity via acquisitions while GS has preferred to grow organically. The result is that, at the end of 2021, MS had a cost of funds of just 12bp vs average assets or well-below the 23bp average for Peer Group 1. GS was at 41bp in Q4 2021 or 2x the peer average. Amazingly, GS generated the lowest net interest margin of Peer Group 1 at just 48bp at the end of 2021.
Source: FFIEC
One of the big concerns we have about GS is credit. Despite the fact that GS is a tiny commercial bank in terms of total assets, the firm regularly reports credit losses that are higher than the average for Peer Group 1, which is comprised mostly of smaller commercial banks. Keep in mind that the Fed has muted loss given default via QE, so the fact that GS is experiencing poor credit performance is remarkable.
Net loans and leases were just 16% of total assets for GS at the end of 2021 vs 23% for MS, but the credit performance of the GS loan portfolio is poor compared to MS. The gross credit losses of GS loan book are an order of magnitude higher than MS or Charles Schwab (SCHW), for example, which barely report credit losses at all. Notice in the chart below that both GS and Raymond James (RJ) reported large, idiosyncratic credit losses related to COVID at the end of 2020. Peer Group 1 also showed above-average losses at the end of 2020.

Source: FFIEC
Given that credit expenses are likely to rise in a secular fashion back to normal levels over the next several years, we believe that the credit performance of GS ought to be monitored carefully by investors and risk professionals. But perhaps even more of a concern than the bank's credit is the firm’s industry leading derivatives exposure.
At the end of 2021, GS had the highest gross derivatives position of the top US banks, followed by MS, Citi and JPM. These positions are predominantly interest rate swap contracts, but notice that the oversize derivative position of Goldman Sachs has little impact of the firm’s above-peer funding costs.

Source: FFIEC
One area where GS excels when compared with the other large banking groups is operating efficiency, where the firm has the lowest efficiency ratio of the top-ten depositories. At nearly five points below JPM in 2021, GS’s efficiency ratio is where it needs to be given some of the disadvantages that face the smallest universal bank in the US market.
In fact, GS is in the bottom quartile of Peer Group 1 in terms of efficiency ratio, an impressive showing given that there are some regional banks with efficiency ratios in the 40- and 30-percent range represented in the unweighted peer average generated by federal regulators.

Source: FFIEC
The bottom line for us when comparing MS with GS is that the former is 20% smaller than Goldman Sachs in terms of total consolidated balance sheet assets, but generates more net revenue with less risk. Simply stated, Morgan Stanley has a much more diverse and sustainable business model than Goldman Sachs
At times GS has “killed it,” to paraphrase one hyperbolic headline from CNBC, with outsize investment banking or trading results. Yet the firm’s business model lacks a solid third leg for the proverbial stool in terms of a large banking business and/or wealth management business.
The dependence upon investment banking and trading results creates inherent instability in the GS business. MS can always depend upon the more stable wealth and investment management lines to pay the bills in times of market volatility or global upheaval as we see due to the war in Ukraine.
For this reason of business model stability, we have long advocated a merger with a large regional bank. Acquiring a large advisory business would also make sense, but SCHW and MS already have largely captured most of the attractive candidates. Sad to say, GS does not have a currency to acquire a large advisory business like SCWW or even RJ, which trade at higher multiples than GS.
When you need to swing for the right field fence on every pitch in order to make next quarters’ earnings, this makes GS vulnerable to large swings in the markets and operational risk events such as the continuing 1MDB scandal in Malaysia. MS is a more stable, lower risk business that naturally has higher risk adjusted returns. As the Fed ends QE and begins to run off its balance sheet, we expect GS to resume its traditional place at a modest discount to book value. MS should trade at a small premium to book, reflecting its more stable business, but we would not buy either stock at current levels.
Disclosure: L: EFC, NLY, CVX, NVDA, WMB, BACPRA, USBPRM, WFCPRZ, WFCPRQ, CPRN, WPLCF, NOVC
The Institutional Risk Analyst is published by Whalen Global Advisors LLC and is provided for general informational purposes. By making use of The Institutional Risk Analyst web site and content, the recipient thereof acknowledges and agrees to our copyright and the matters set forth below in this disclaimer. Whalen Global Advisors LLC makes no representation or warranty (express or implied) regarding the adequacy, accuracy or completeness of any information in The Institutional Risk Analyst. Information contained herein is obtained from public and private sources deemed reliable. Any analysis or statements contained in The Institutional Risk Analyst are preliminary and are not intended to be complete, and such information is qualified in its entirety. Any opinions or estimates contained in The Institutional Risk Analyst represent the judgment of Whalen Global Advisors LLC at this time, and is subject to change without notice. The Institutional Risk Analyst is not an offer to sell, or a solicitation of an offer to buy, any securities or instruments named or described herein. The Institutional Risk Analyst is not intended to provide, and must not be relied on for, accounting, legal, regulatory, tax, business, financial or related advice or investment recommendations. Whalen Global Advisors LLC is not acting as fiduciary or advisor with respect to the information contained herein. You must consult with your own advisors as to the legal, regulatory, tax, business, financial, investment and other aspects of the subjects addressed in The Institutional Risk Analyst. Interested parties are advised to contact Whalen Global Advisors LLC for more information.


Comments