
Top Five Banks: JPMorgan Leads the Pack
- Jul 3, 2023
- 7 min read
July 3, 2023 | Premium Service | The 2023 Federal Reserve stress test results released this past week demonstrate that large banks in the U.S. are highly resilient to a severe stress scenario imagined by economists. This says nothing about the soundness or profitability of these banks, however, especially given recent market volatility. In such an environment, no surprise, JPMorganChase (JPM) is outperforming its asset peers while smaller banks stumble.
Higher levels of capital would not have changed the outcome for Silicon Valley Bank or the other casualties of rising interest rates. With that caveat in mind, below follows our setup for Q2 2023 earnings for financials. The first comment to make is that banks generally are getting smaller and are looking to shed problematic credit exposures sooner rather than later. These disposals, coupled with a general decline in lending volumes across the board, is likely to put downward pressure on assets and in some cases bank earnings in Q2 2023.
Some observers think that bank loan prices remain stable, but in fact the flow of loans and related servicing assets being sold by banks already has become a torrent. The decision by Comerica Inc (CMA) to suddenly exit mortgage warehouse lending after 110 years in the business, without even attempting to sell the business, illustrates the point about panicked shrinkage of balance sheets and overhead costs.
Securities holdings and deposits are down high single digits year-over-year, but other borrowed funds is up 100% to $1.9 trillion or 10% of total industry assets. Fact is, things in the bank channel are a bit confused and likely to get worse in the near-term as banks take assets to the curb. We expect to see funding costs at least double in Q2 2023, putting additional pressure on banks to increase loan rates and/or reduce assets.

Source: FDIC
During Q1 2023, loan balances across the industry actually grew while securities holdings fell over 10%. This suggests that banks are not only selling unattractive assets, but are buying newer, higher coupon assets to bolster earnings and stay ahead of galloping funding costs. Banks with shorter durations on their assets are at a big advantage over other institutions.
This leads us to the second general trend that banks are adding to the gross spread on lending products at a brisk pace. The pace being set by some of the better performers in our surveillance group will put a great deal of pressure on the public equity securities of the laggards. Note in the chart below that the better financial performers are also leading the way in terms of valuation.

Source: Google
In Q1 2023, Citigroup (C) added more than 2% to its gross loan spread, pushing this key metric to almost 8.5%. Right behind Citi was JPMorgan, which took up its gross yield 1.75% in the past quarter. The average yield for the 140 banks in Peer Group 1 moved over a point to 5.6%. Wells Fargo (WFC) and U.S. Bank (USB) saw the least improvement in gross yield but had much lower increases in funding costs. Notice that USB has suffered in market value since March 2023, a direct result of being below $1 trillion in total assets.

Source: FFIEC
The reason for the herculean efforts to raise revenue is that interest expenses are rising even faster. No surprise that Citi saw funding costs double to 2.6% of average assets in the quarter. Right behind C was Bank of America (BAC), which saw its funding costs rise 3x in Q1 2023 to 1.83% even as it wallowed at the Peer Group 1 average loan yield. WFC saw the smallest increase in funding costs, yet another notable area of improvement for the $1.8 trillion asset bank.

Source: FFIEC
In terms of credit, Citi has seen a relatively sharp increase in credit costs since 2022, leading the top five bank group higher after several years of below-average loss rates due to QE and COVID loan forbearance. The rest of the group is seeing only gently increasing credit expenses across most portfolios, with commercial real estate showing the fastest rate of increase in defaults.
Source: FFIEC
Top of mind, naturally, is the degree of commercial exposure on the lending book. JPM CFO Jeremy Barnum said in the Q1 earnings call: “[T]he large majority of our commercial real estate exposure is multifamily lending in supply-constrained markets. And I think it’s quite important to recognize the difference between that and sort of higher-end, higher price point, non-rent-controlled, not supply-constrained markets.”
According to the IR narrative, JPM has also worked to minimize exposure to office buildings outside of the “A” class space located in central urban locations where the return to work narrative has legs. More important, only about 30% of JPM's $3.7 trillion in total assets were in the $1.1 trillion in net loans and leases at the end of Q1 2023. There's another trillion in bank deposits and repurchase agreements, and $500 billion or so in trading assets. JPM is really a large mutual fund with a bank attached, as shown in the table below.

Source: FFIEC
Of note, rising coupon rates do not seem to be slowing down impatient consumers. With lenders writing mortgages with 7% coupons for agency and government loans, and in double digits for private jumbo paper, you’d think that the market would be slow. But persistent demand is still helping lenders fill pipelines with purchase mortgages. “Housing is in short supply in America,” noted JPM CEO Jamie Dimon in Q1. “So, it’s not massively oversupplied like you saw in 2008.”
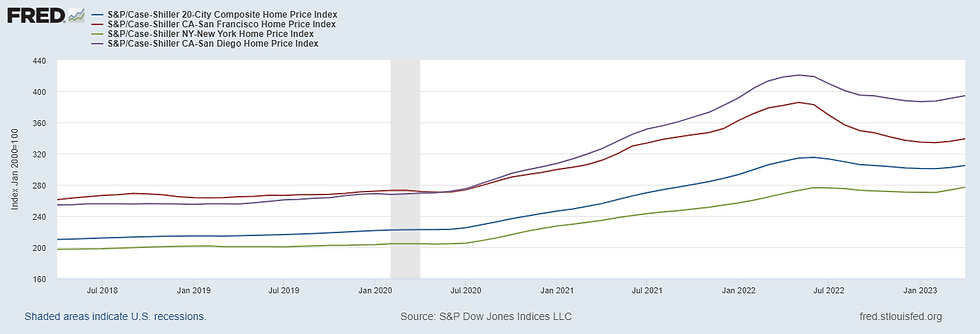
Consider the startling fact that after dropping in nine previous months, the national median home price accelerated 10.2% to $350,000 from $317,496 between the first and second quarters this year, according to market data provider Attom. Inflation and a lack of new home construction is keeping asset values high, even though some speculative markets in the south and west have clearly cooled. The chart below from FRED shows the Case-Shiller index for the US and major markets. Notice that progressive New York is the worst performing market of the group.
In the world of commercial real estate, San Francisco, Houston and even blessed Austin are correcting. Several direct lenders we follow in the commercial space have basically said no to new opportunities in Houston and are starting to slow purchases across the state of Texas. And by no coincidence, China’s real estate sector is also slowing dramatically after years of pump-priming by the Chinese Communist Party.
One big reason that the top five banks are still reporting reasonable earnings is the fact that credit default rates remain subdued and well-below levels seen prior to 2020. “The net charge-off rate of 0.41 percent increased 5 basis points from the prior quarter and 19 basis points from the year-ago quarter,” the FDIC noted in Q1 2023. “The annual increase was led by higher credit card net charge-off balances. Despite the increase, the industry’s net charge-off rate remains below the pre-pandemic average of 0.48 percent.”
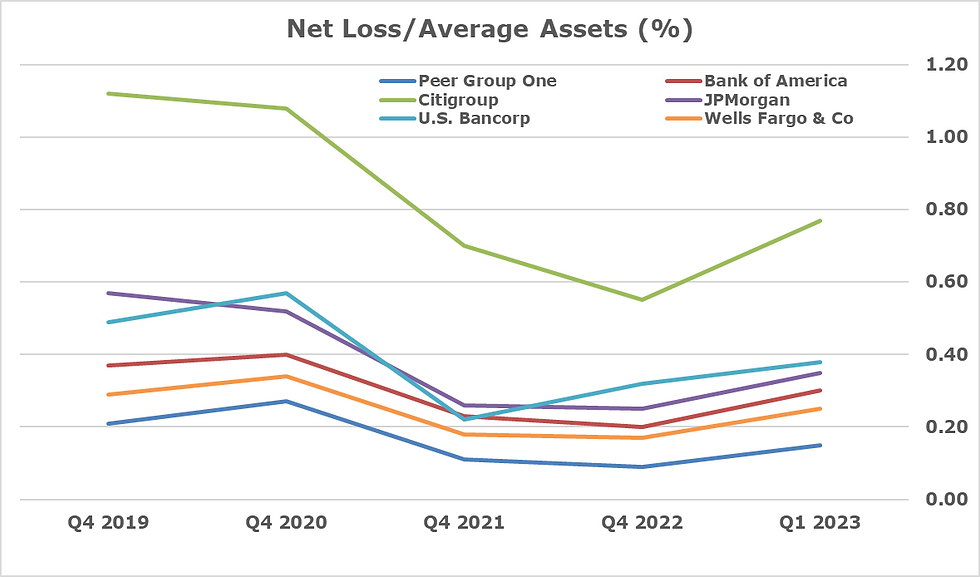
The biggest threat to bank earnings remains market risk rather than credit. As the chart below illustrates, the leader of the group in terms of asset returns is JPM followed by Wells Fargo, of note. WFC may be the most improved member of the top-five banks after years in regulatory purgatory. Notice that Citi continues to significantly underperform the group, one reason why the stock is trading at half of book value.

Source: FFIEC
In terms of operating leverage, JPM continues to lead the group first in asset returns and also by maintaining an efficiency ratio in the 50s vs the 60% or 70% range for other members of the group. Efficiency (Overhead expenses / Net Interest Income + non-interest income) is a key measure of the management in a bank. The other key measure is loss given default, a fancy way of saying net credit losses. But operating efficiency is ultimately what separates the very good banks from the rest of the industry. Note that BAC is next in our group at 61% efficiency, 10 points above Jamie Dimon!
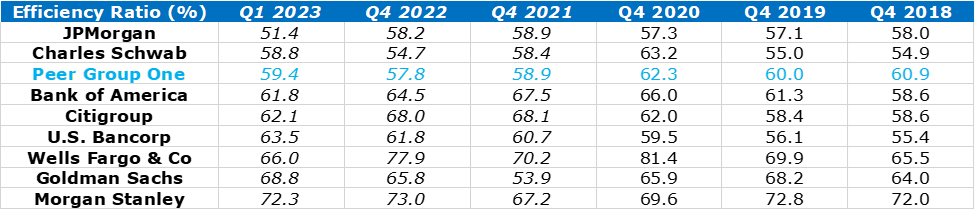
Source: FFIEC
Notice that Charles Schwab (SCHW) has the best operating efficiency in the group after JPM and almost even with Peer Group 1. The clear message from the Q1 2023 results is that JPM is extending its lead over its asset peers, while smaller banks such as Citi and USB are struggling to keep pace. Wells Fargo continues to improve and may be worthy of attention, while BAC's performance remains mediocre and USB has lost a step vs JPM.
The sharp increase in funding costs for the $3.1 trillion BAC was a surprise and is reason for concern going forward because of the bank's poor asset returns and credit performance. BAC's loss rate is right behind JPM and USB, both of which have higher yields on the book to offset credit losses. All of the top five banks need to keep operating efficiency in the low 50s to be competitive long-term as credit costs steadily rise into 2024.

The Institutional Risk Analyst (ISSN 2692-1812) is published by Whalen Global Advisors LLC and is provided for general informational purposes only and is not intended for trading purposes or financial advice. By making use of The Institutional Risk Analyst web site and content, the recipient thereof acknowledges and agrees to our copyright and the matters set forth below in this disclaimer. Whalen Global Advisors LLC makes no representation or warranty (express or implied) regarding the adequacy, accuracy or completeness of any information in The Institutional Risk Analyst. Information contained herein is obtained from public and private sources deemed reliable. Any analysis or statements contained in The Institutional Risk Analyst are preliminary and are not intended to be complete, and such information is qualified in its entirety. Any opinions or estimates contained in The Institutional Risk Analyst represent the judgment of Whalen Global Advisors LLC at this time, and is subject to change without notice. The Institutional Risk Analyst is not an offer to sell, or a solicitation of an offer to buy, any securities or instruments named or described herein. The Institutional Risk Analyst is not intended to provide, and must not be relied on for, accounting, legal, regulatory, tax, business, financial or related advice or investment recommendations. Whalen Global Advisors LLC is not acting as fiduciary or advisor with respect to the information contained herein. You must consult with your own advisors as to the legal, regulatory, tax, business, financial, investment and other aspects of the subjects addressed in The Institutional Risk Analyst. Interested parties are advised to contact Whalen Global Advisors LLC for more information.


Comments